Sample Biostatistical Support Provided
Patient Profile Plot
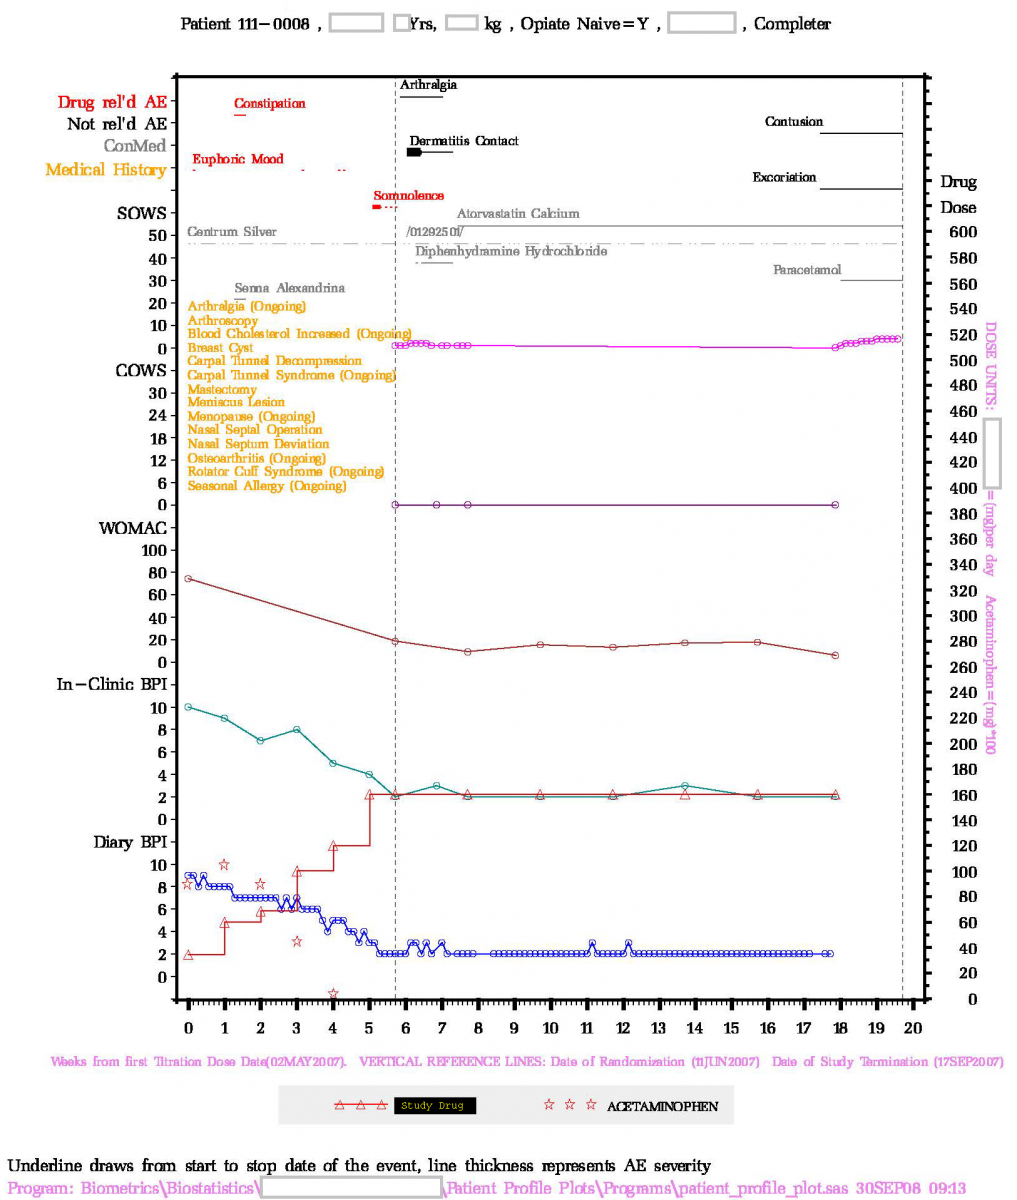
Patient profile plot can be very useful in understanding the relationship between the study drug administration and patient's safety and efficacy responses. Chao invented the patient profile plots for the FDA medical officers to facilitate the NDA review. As a result, Chao received the FDA's outstanding service award for "Excellence in Statistical Computing Involving Complex Statistical Problems and Graphical Presentation Presentation of Clinical Data". This work has been fine tuned since then. Presented below are two examples showing how the plot helps the data review.
Example 1. This study investigate the efficacy and safety of an opioid-deterrent medication. This plot shows as the dose of the study medication (red triangle) was titrated up, the use of the rescue medication (red star) decreased along with the reduction in the pain intensity BPI (blue circle for daily diary and cyan circle for in-clinic assessment) and WOMAC scores. The clinical and subjective opioid withdrawal scores, COWS and SOWS, show no opioid withdrawal effect during the treatment and follow-up period. As expected, the patient experienced treatment-related brief period of mild "constipation", 4 episodes of mild "euphoric mood", and a brief period of moderate, followed by 3 incident reports of mild, "somnoloence".
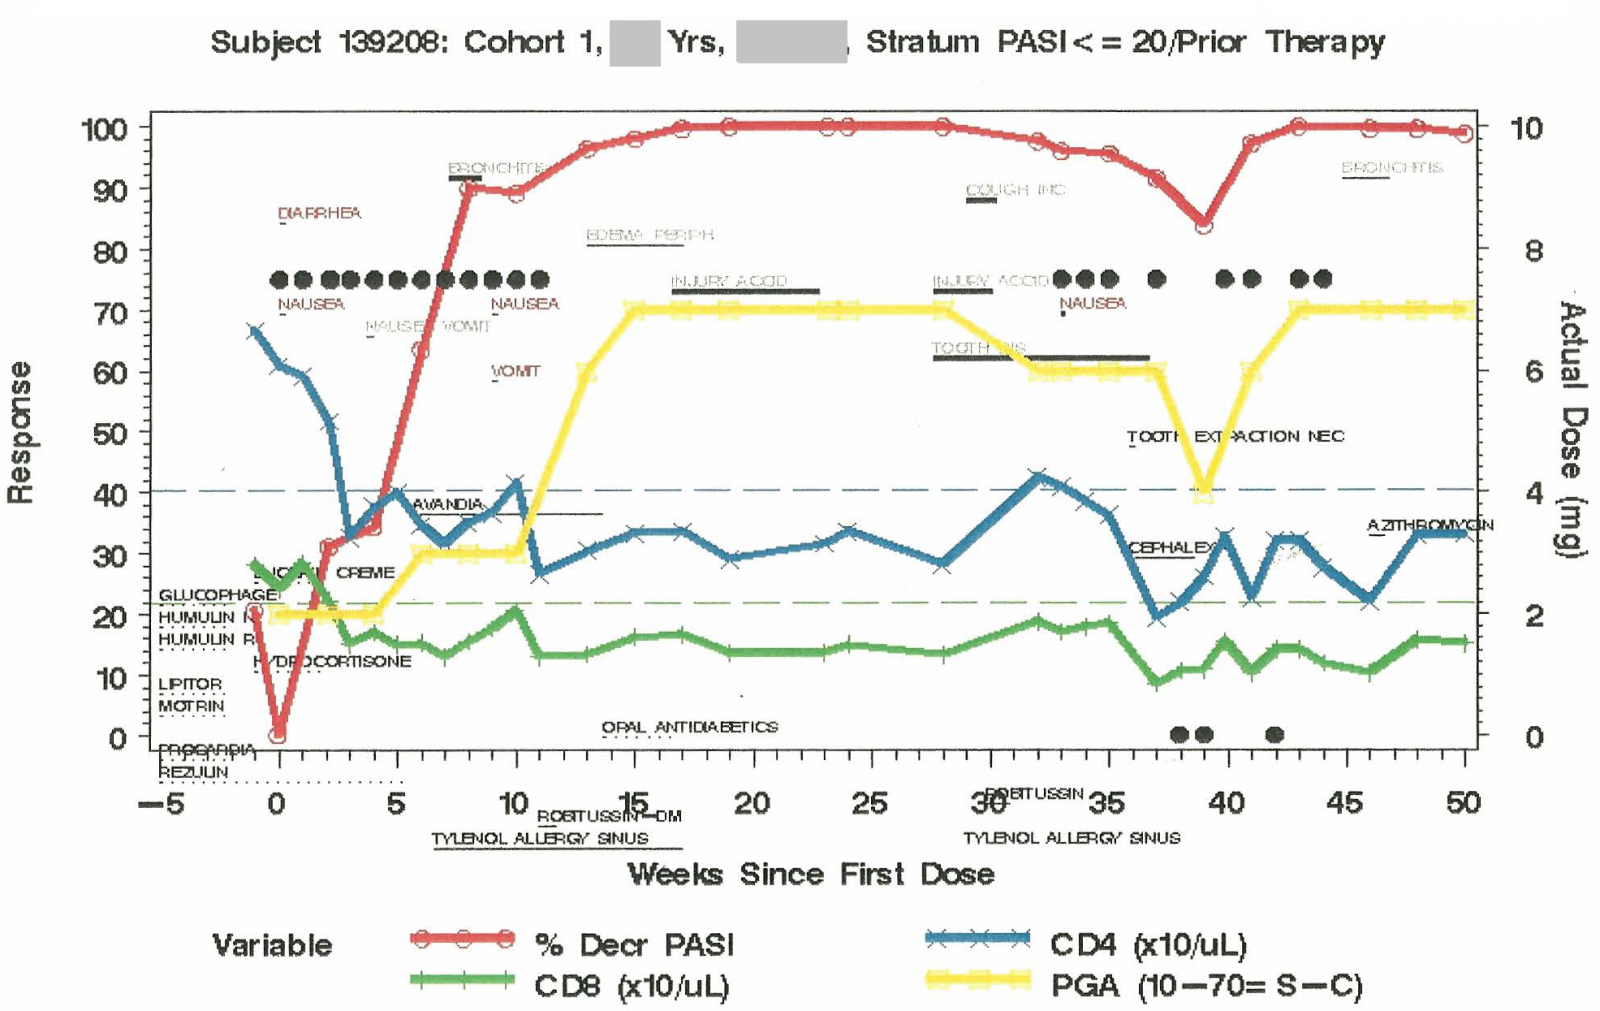
Example 2. This study investigate the efficacy and safety of a psoriasis drug. The study drug (black solid circle) was given weekly for the first 12 weeks. After 24 weeks of break, the study drug was given again for another 12 weeks. In the second 12-week treatment period, the study drug was missed for Week 4, and was intentionally withheld for Weeks 6, 7, and 10. There was a great reduction (almost 100%) in the psoriasis area severity index (PASI) score and an increase in the physician global assessment (PGA) score suggesting the effectiveness of the study drug. However, both CD4 and CD8 counts dropped to below the lower limit of the normal range suggesting the potential non-selective immune suppresion effect of the study drug. In addition to the reports of the study drug-related diarrhea, nausea, and vomiting, this patient experienced non-study drug-related bronchitis and cough, which might be caused by the non-selective immune suppresive effect of the study drug.
Forest Plot
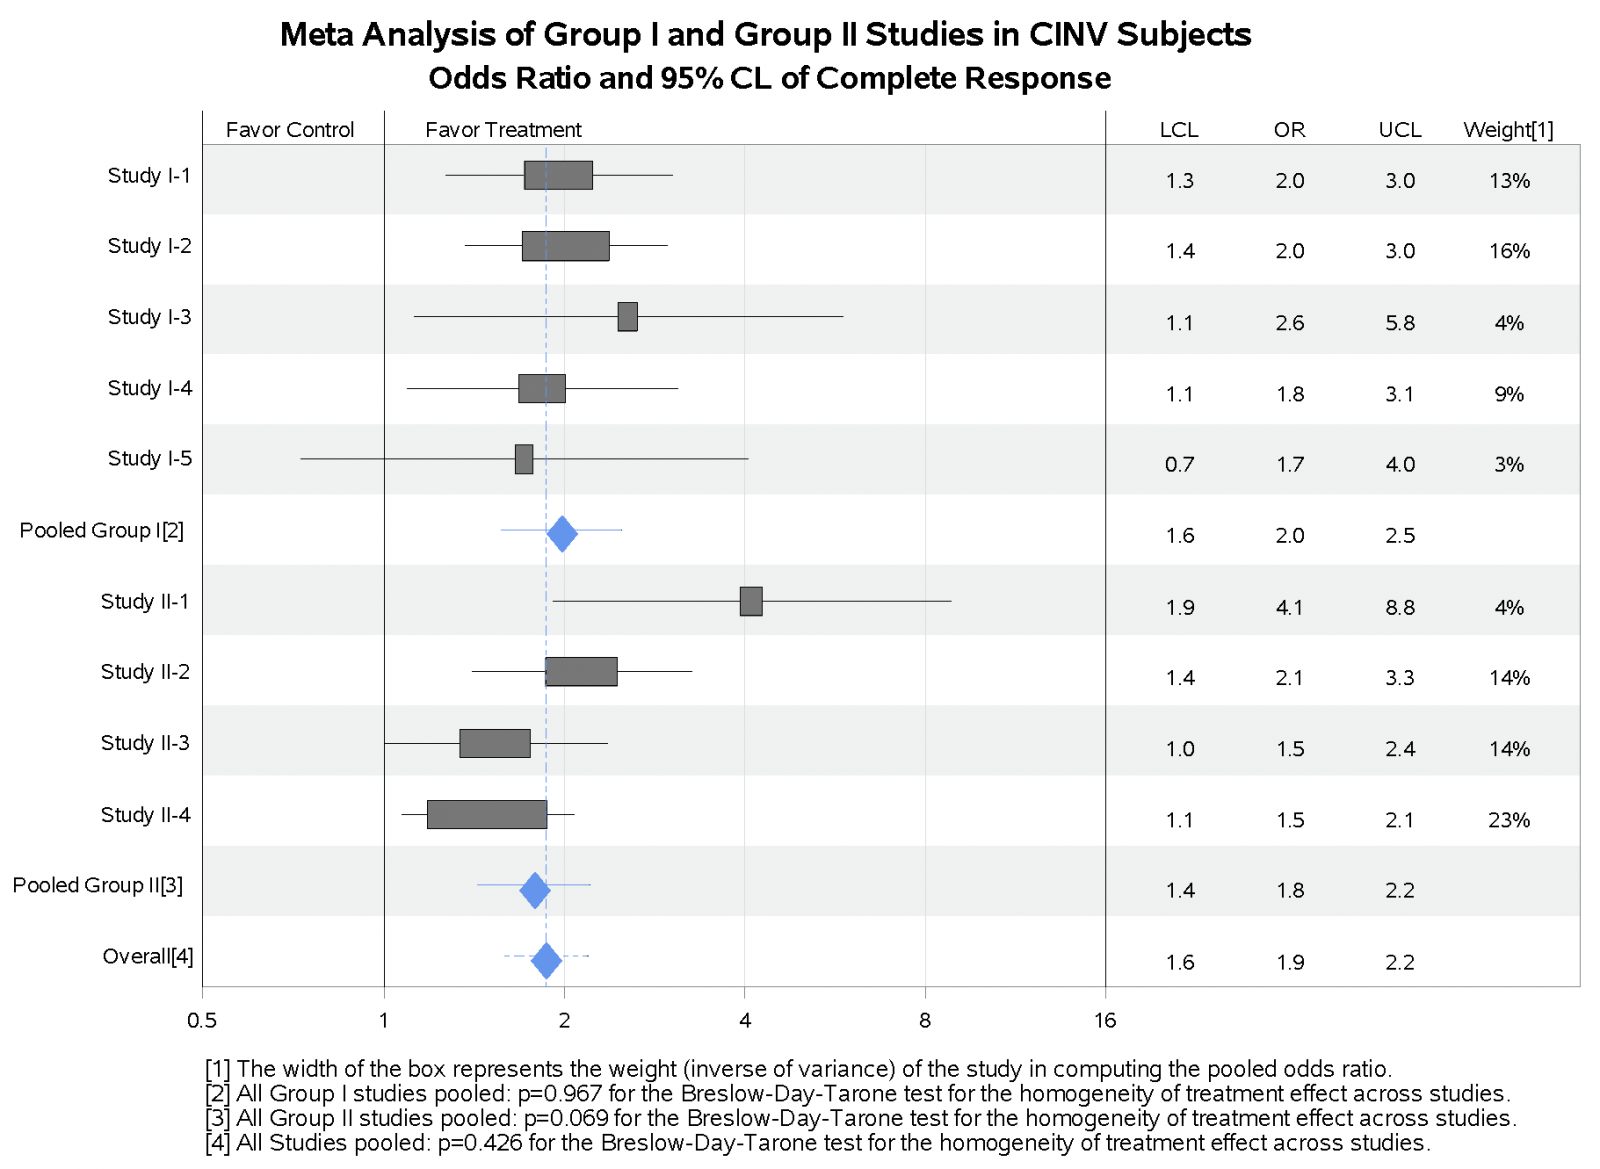
Forest plot is frequently used to examine the treatment effect across studies or across subgroups of patients within the same study. The plot below shows the treatment group comparison for individual studies as well as for the studies pooled.
Star Plot
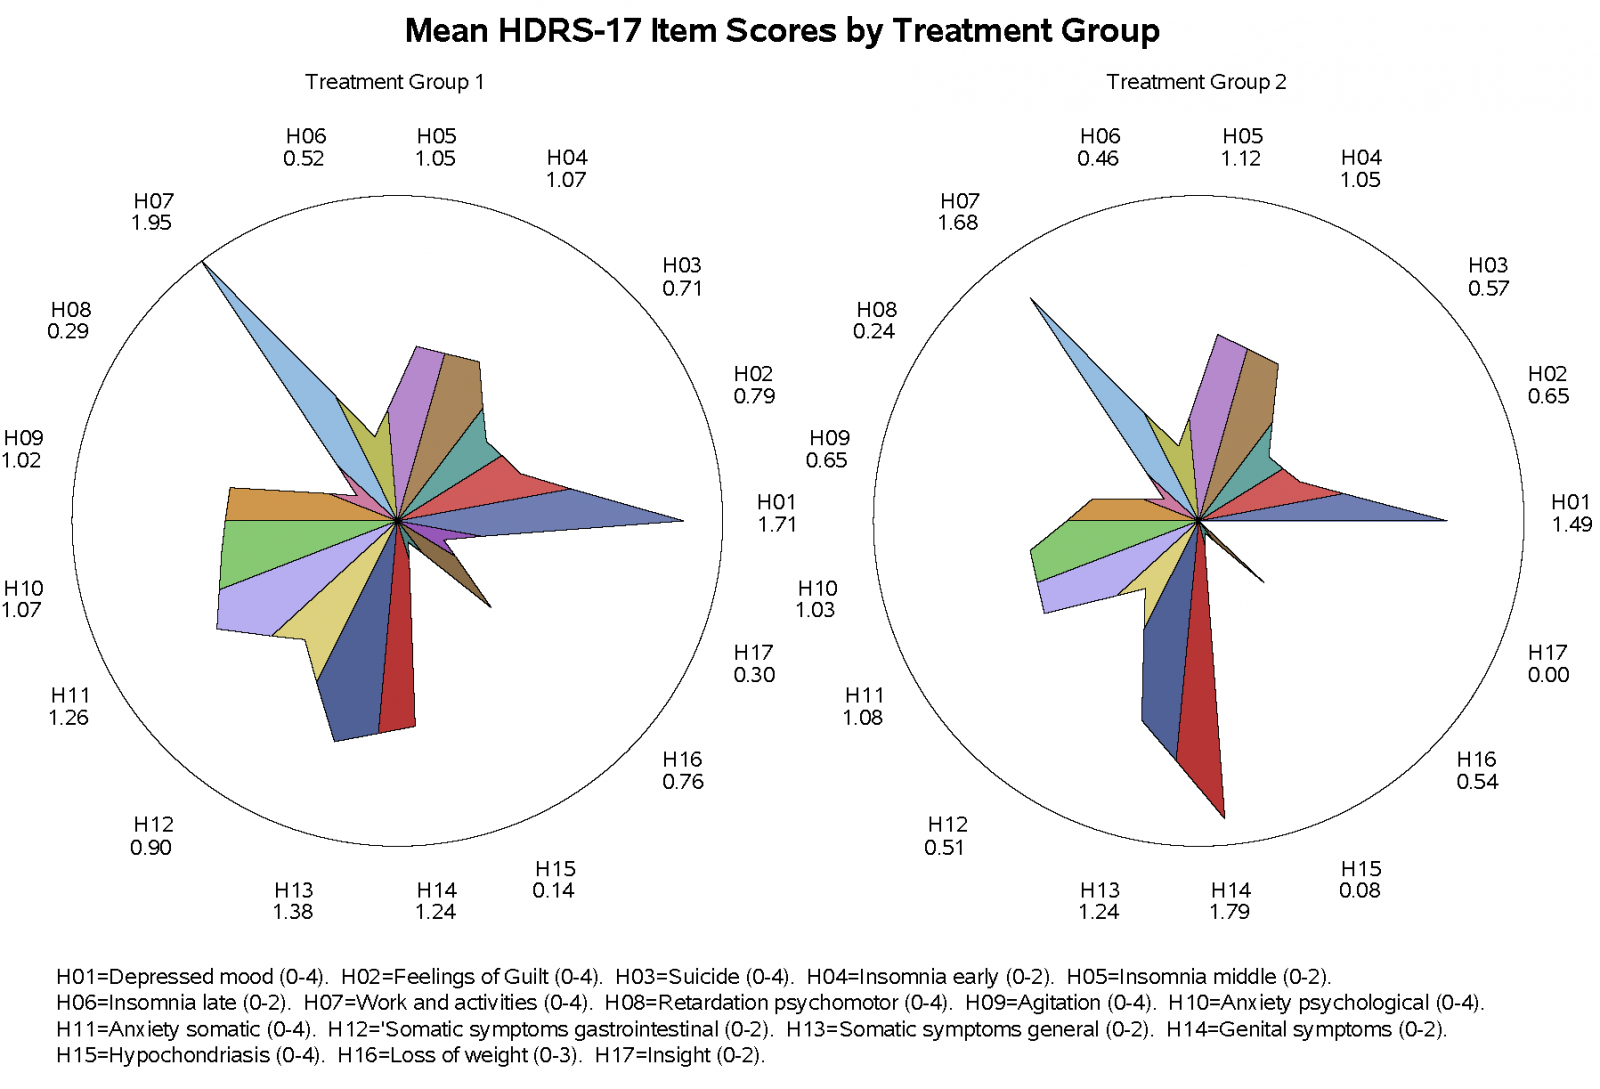
Star plot can be used to quickly explore how the item scores contribute to the composite score. Illustrated below is the star plot showing patients in Treatment Group 2 having an improved Hamilton Depression Rating Scale for almost all 17-Item scores with the exception for Items 5 and 14.
Conditional Power Calculation for Interim Analysis
Power/Sample Size Calculation for SPCD (Sequential Parallel Comparison Design)
website in construction